Original post: Aug 25, 2015
In light of recent turmoil in the world markets, we can see how interconnected the global economy really is. Now, more than ever, it's important for us to understand how our products and services fit into the new world economy.
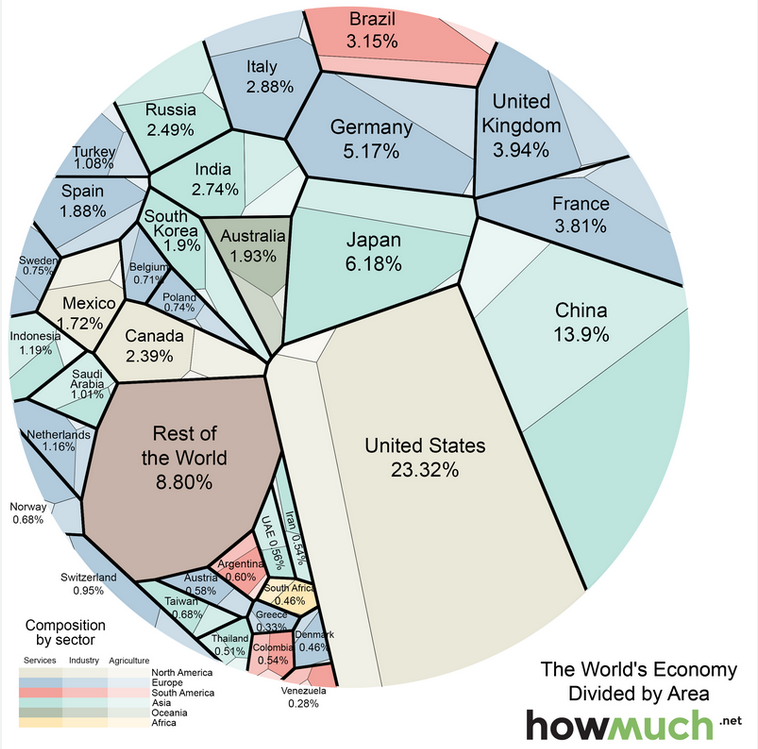
Infographics are new ways to visualize data. This particular graphic divides the global economy by country to give an idea of relative size in Gross Domestic Product (GDP--a common measure of the value of goods and services in an economy). Each slice is then further subdivided to show three different sectors within each country: agricultural, manufacturing, and services. That view illustrates some interesting dynamics:
I am surprised by how much the US is dominated by services. I also did not realize how services are also dominant in most other countries around the world. Given how much we hear about manufacturing (particularly in China and Germany), it's interesting to note that it is still a minority of the economy in all of these major countries.
I also did not realize that Brazil's economy was larger than India, South Korea, or Russia!
Here is the link to the full article:
This striking diagram will change how you look at the world economy - Vox
No comments:
Post a Comment